Interim results
The Hellenic Competition Commission (HCC), within the framework of its responsibilities and in order to investigate whether the conditions for initiating an ex-officio investigation for suspected violations of the provisions of Law 3959/2011 (the Greek Competition Act) in public procurement tenders are met, launched an investigation in the markets of a) healthcare materials, b) other appropriate means of individual or collective protection against the spread of coronavirus and c) special hospital equipment for the treatment of coronavirus cases, evaluating supply data before and after the application of the legislative act Α΄42/25.2.2020, ar. 19 of Law 4675/2020.
The purpose of this preliminary investigation is to identify those companies which, during the health crisis of COVID-19 in Greece, proceeded in excessive and/or exploitable pricing. This action was deemed necessary following the sudden increase of demand for specific healthcare and medical equipment and the need for immediate supply of certain products departing from the standard public tender processes, which may have led to increased prices deriving from value chain business practices that may fall under the provisions of Law 3959/2011.
Extensive research has been carried out by the HHC throughout the healthcare distribution chain (gloves, disposable masks and antiseptics, see relevant press releases for the launch of the investigation and the preliminary conclusions) as well as in specific food markets (see relevant press releases for the launch of ex-officio research in various food categories and first conclusions as well as dawn-raids in the citrus market) during the COVID-19 health crisis in Greece.
The research was based on two data sources: data collected by the HCC from the seven (7) Health Regional Units of the country and data from the open public procurement platform "Diavgeia.gov.gr".
In particular, on 16.4.2020 and subsequently on in 23.4.2020, the HCC sent questionnaires to the Health Regional Units of Greece, requesting information on the supply of healthcare materials (surgical masks, masks FFP2/FFP3, antiseptics, disposable gloves, Tyvec uniforms, eyes protection, protective glasses, protective shields, disinfectant tablets, thermometers, flow meters, etc.) for the period from November 2019 to March 2020, as well as during the months from November 2019 until the emergency response measures to COVID-19.
The data contains information for each public tender with regard to the contracting authority, the product purchased, all the suppliers who submitted bids as well as the winning bidder, the price per unit of product, the type of procurement process (direct supply, informal tender, calls for proposals, etc.), the selection and award criterion and the signature date of the contract. From this data, 12 products were selected, for which there were many observations and the sample was processed, omitting those observations from which data for key variables were missing. The observations used for further analysis from data collection amounted to 808.
Data from DIAVGEIA was collected through the development of algorithms (using Application Programming Interface - API), in three basic steps, as the speed, volume and variety of structure and nature of the information exchanged requires special technology and analytical methods for its conversion into exploitable data for the detection of anti-competitive practices.
In particular the administrative data was semi-automatically collected in three steps.
At the first stage of the processing of the data, potentially relevant contracts were searched through the Diavgeia API using products’ keywords (e.g., “ΜΑΣΚΕΣ”, “ΓΑΝΤΙΑ”, “FFP3”). Next, the metadata of these contracts and the corresponding files were downloaded at a local database in order to be further processed. The contracts’ files that were retrieved are in the format of exploitable, semi-structured PDF-files, i.e. they contain unstructured non-uniform information which cannot be easily and readily extracted in exploitable mode for the total of the contracts. It should be noted that during this first stage of analysis, the aim was to export big data on which to test the application and adjustment of tailor made algorithms, in order to render it exploitable for the extraction of relevant data.
At a second stage, that of data pre-processing, the collected results were reviewed and filtered, allowing for the rejection of possibly biased results. This stage, which is what we call feature engineering, aims at the dimensional normalization of the results and also at the gradual improvement and update of the API queries’ parameters. Consequently, API queries’ parameters were updated to retrieve only the most relevant contracts. Through the several rounds of data cleansing, re-sampling and review, the sample of contracts and other administrative data files decreased from more than 150.000 thousand to 2.584 contracts.
Finally, at the third stage of the analysis and given that Diavgeia API does not allow for collecting unit prices, the algorithm was further elaborated in order to export unit prices from the semi-structured exported big data. More specifically, automatic data extraction methods were applied using Camelot and Tabula software Python packages, in order to identify prices for the relevant products from PDF-files for the sample of 2.584 contracts. Data extraction was successful for 692 contracts (27% of the sample). However, only 109 contracts out of this sample exported from Diavgeia were selected for further analysis as only these records contained unit prices for the products that were represented in the survey (e.g., surgical masks, latex gloves).
Through this exercise, the HCC team managed to set the framework for the next steps of analysis, that is, the study, design and “training” of a self-taught algorithm which does not depend on manual intervention for the repetition of the above steps, using Natural Language Processing and Machine Learning Processes. The aim is to set up a platform where algorithm will be applied on publicly available data in order to trace price outliers which can serve for further investigation according to the provisions of competition law.
The final set of data analyzed includes 917 observations: 808 from the data collected from the Health Regions and 109 from DIAVGEIA platform. The purpose of the analysis is to identify unusually high prices for the products under investigation. The assumption is that within these product groups, there is relatively unobserved variability in product quality hence the analysis can concentrate on prices only. The analysis first proceeds in a simple bivariate set-up looking at unit price in the pre/post crisis periods. Second, the prices are examined in a multivariate set-up also controlling for district, buyer fixed effects, procedure type and purchased quantity[1].
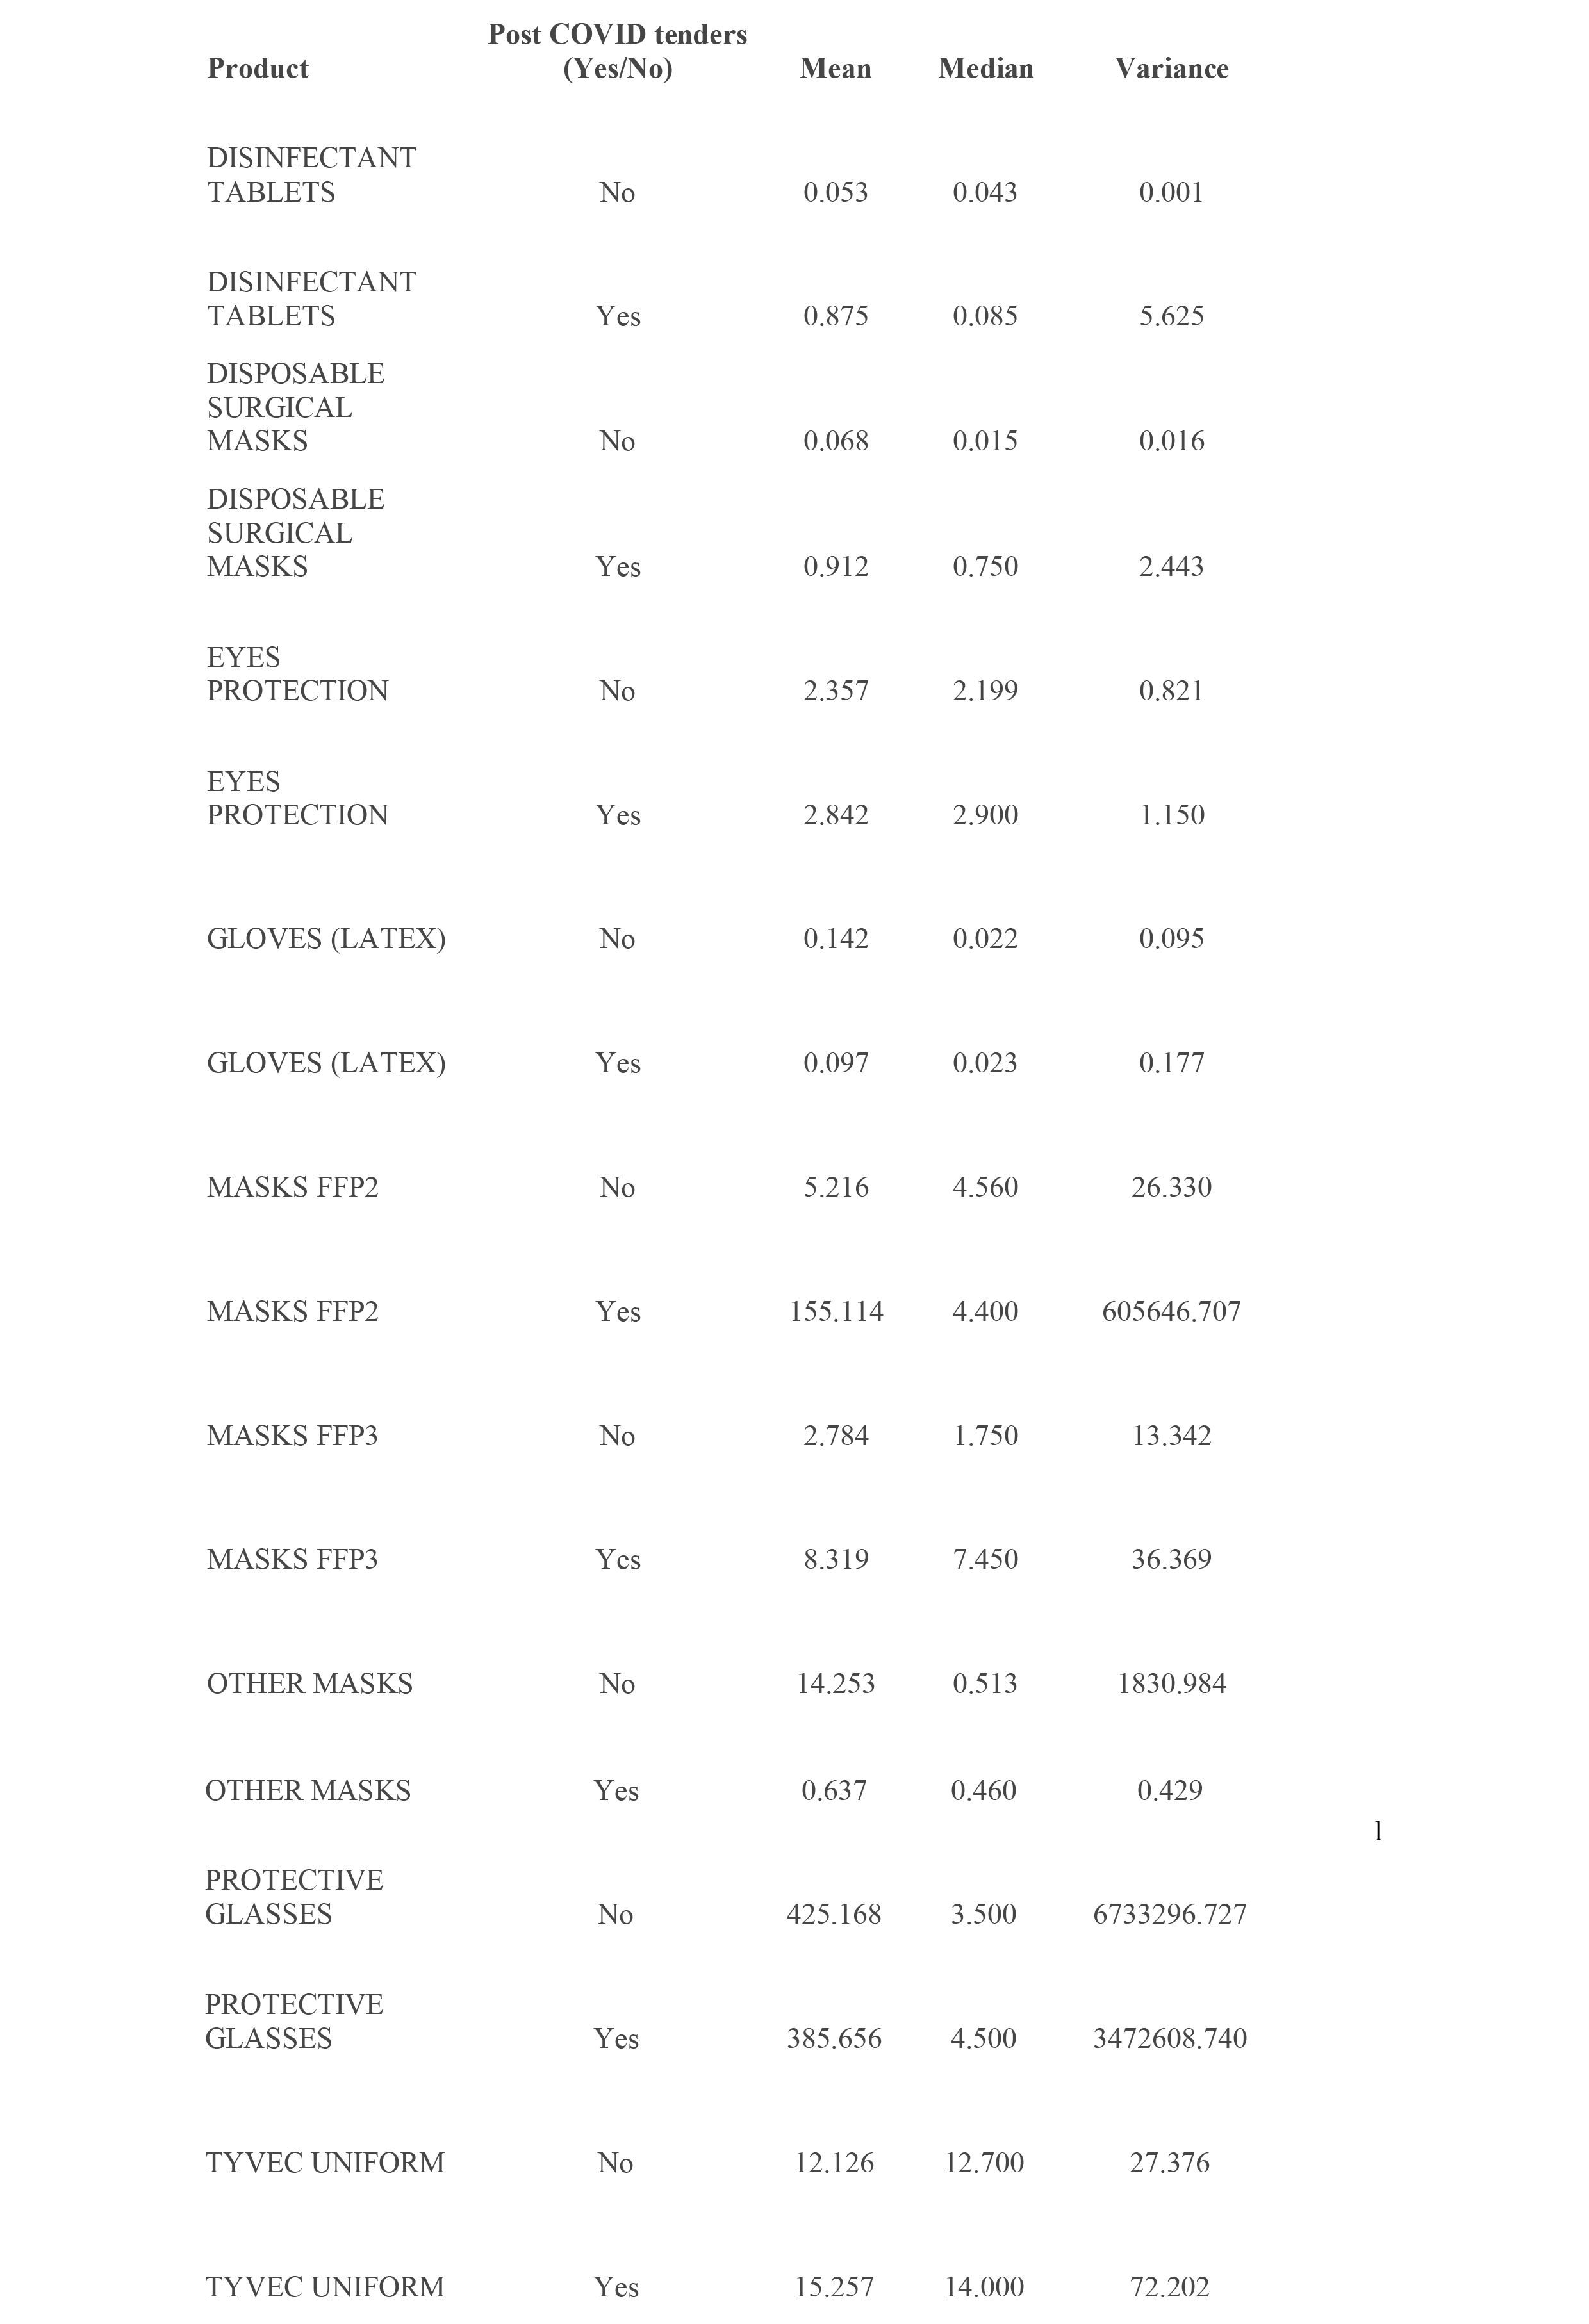
The simple comparison of pre/post crisis group averages and variances within each product category gives a sufficient insight into general price movements over time. Unsurprisingly, for virtually all product categories with sufficient number of observations, the median unit price increased[2] while unit price variances also skyrocketed (Table 1).
A comparison of average prices and fluctuations before and during the COVID-19 period in each product category provides an overview of general price changes over time. Unsurprisingly, for most of the product categories investigated with a sufficient number of comments, the median price increased, while in most cases the fluctuations also increased (Table 1).
Table 1: Descriptive Statistics for Unit Price Values by Products and Pre/Post COVID Crisis Periods[3]

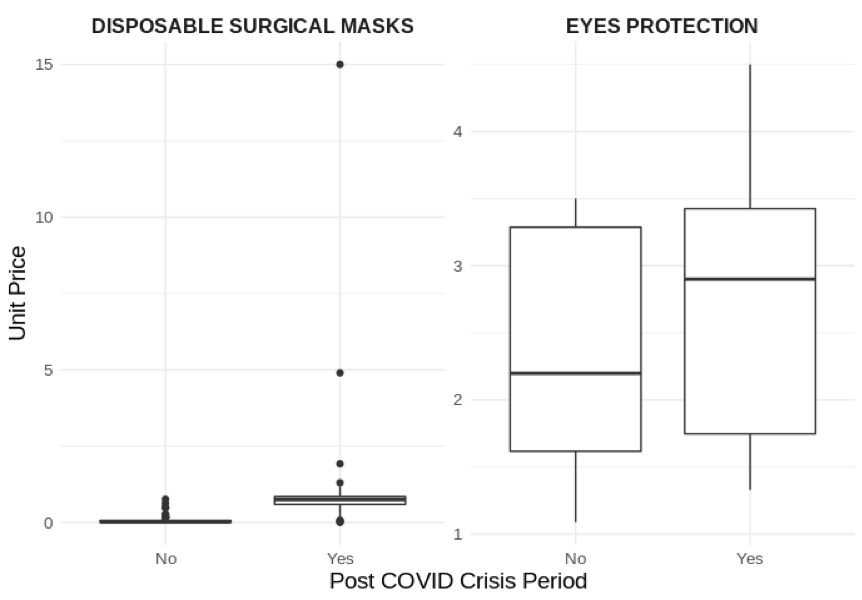
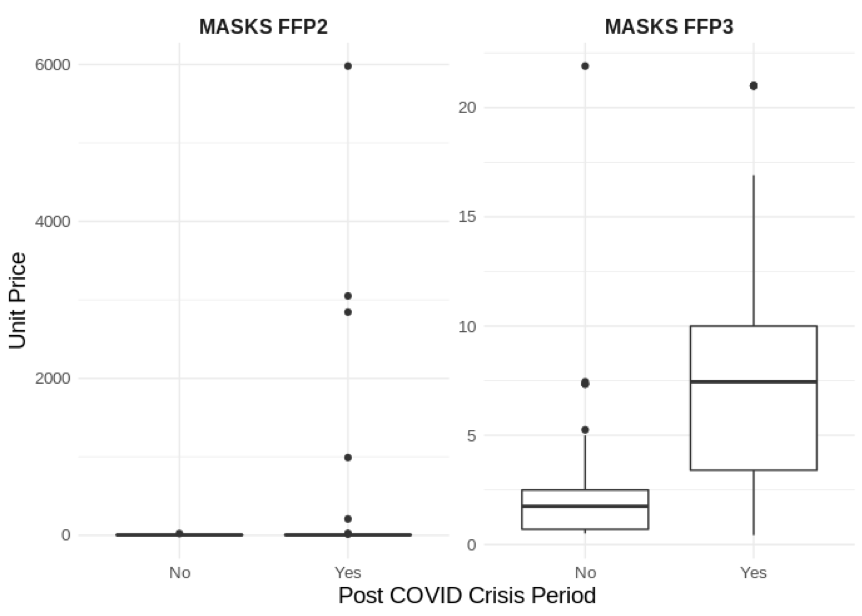
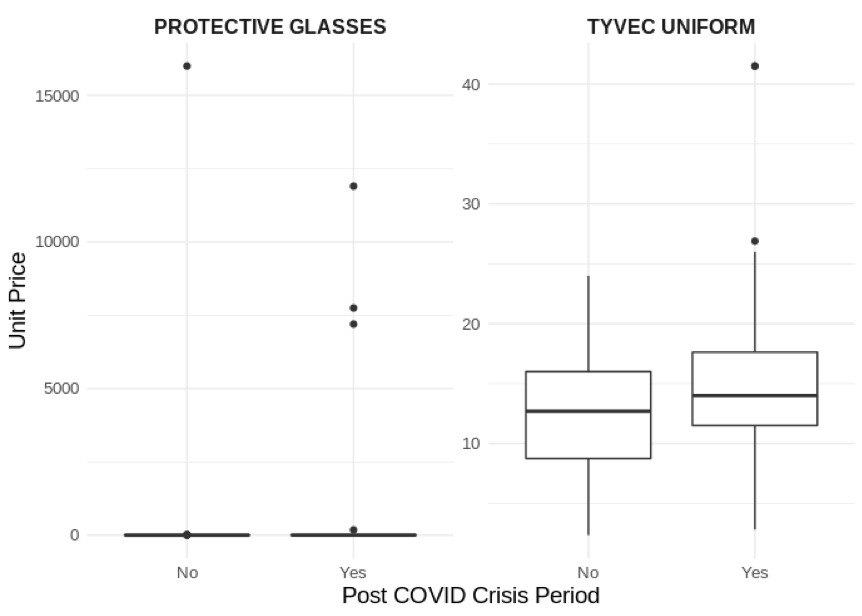
The increased variation around the median values is also indicated by box plots (Charts 1-4), in which the dots represent the observed extreme values.
Charts 1-4: Box Plots of Unit Price Values by Products and Pre/Post COVID Crisis Periods[4]


As outlined before, first the process looks at outliers in a simple bivariate setting: pre/post crisis unit prices. For this bivariate outlier identification, means and standard deviations were calculated for each product in the data. The records with unit prices higher than +2 standard deviations from the average price were identified as outliers.[5]
Overall, there are 120 unique suppliers represented in the data. Based on the bivariate identification of outliers, 29 suppliers were selling products 1 standard deviation above the average price of the given product, while for 17 suppliers, the price overturned the mean values by 2 standard deviations. While this is potentially indicative of some sort of unusual behavior, a range of alternative explanations may account for outliers. Hence, we look at potential outliers in a multivariate setting.
The multivariate outlier identification relied on linear regression analysis with the log unit price as the dependent variable, using as independent variables pre/post crisis dummy, product class fixed effects, log quantity purchased, district of the procuring entity, procuring entity fixed effects and procedure type as well as interacted effects between these variables. The observations were considered as highly probable outliers if their residuals were larger compared to other observations.
Below are presented some indicative regressions with significant explanatory power.
Table 2: Interacted OLS[6] regression results
 For the regression-based identification of the outliers, the model with highest explanatory power is chosen. Overall, the model with interactions effects fits data better than the others (R2 = 81%). Thus, the model with interactions (Column 2) was selected to identify outliers based on the error term distribution. In this model, the error term behaves as expected, not suggesting any systematic error in model building, albeit more regression diagnostics could be carried out (Table 3).
Table 3: Descriptive Statistics for the Model’s Error Term
 To identify outliers, we averaged the model’s error term for the post-crisis period by supplier and plotted the distribution of the calculated values. Chart 5 suggests that the distribution is symmetrical with a few highly probable outliers. The blue dotted line highlights the chosen cut-off point/ threshold (x=0,8) for the identification of the observations that fall outside the pattern. Observations located to the right from the cut-off point are considered to be potential outliers.
Chart 5: Distribution of the Model’s Error Term Averaged by the Supplier.

According to the results of multivariate modelling, unit prices offered by five (5) suppliers in the post crisis period can be considered as potential outliers. Two (2) of these suppliers were identified as outliers in the simple bivariate set-up.
The HCC will further investigate any anti-competitive practices by imposing severe fines in case of any infringements of competition law. The development of algorithms that enable the automated analysis of Big Data derived from publicly available procurement databases is a primary goal and priority for HCC.
The HCC reiterates, as in its previous announcements, that in the current situation in which the country is being afflicted by the coronavirus pandemic, the HCC will continue to intervene, wherever and whenever necessary, within its powers of finding any violations of the provisions of law 3959/2011 and articles 101 and 102 TFEU in order to protect the competitive market structure, consumer interests and economic growth.
[1]This latter variable while crucial in determining prices, is often missing so it is used only in a subset of the analyses.
[2]The median value is more reliable for comparisons as there are a number of extremely high unit price observations. Nevertheless mean group averages also largely follow the same pattern as median values.
[3]Note: only products with sufficient number of observations (N => 5) for both periods were included in the table.
[4]The distributions of unit price were plotted only for the products represented in Table 1.
[5]In a normal distribution, about 68% of the observations are within a standard deviation from the mean and about 95% of the observations are within two standard deviations from the mean.
[6]Number of observations dropped after removing products with less than 10 observations for Pre and Post COVID crisis periods.

